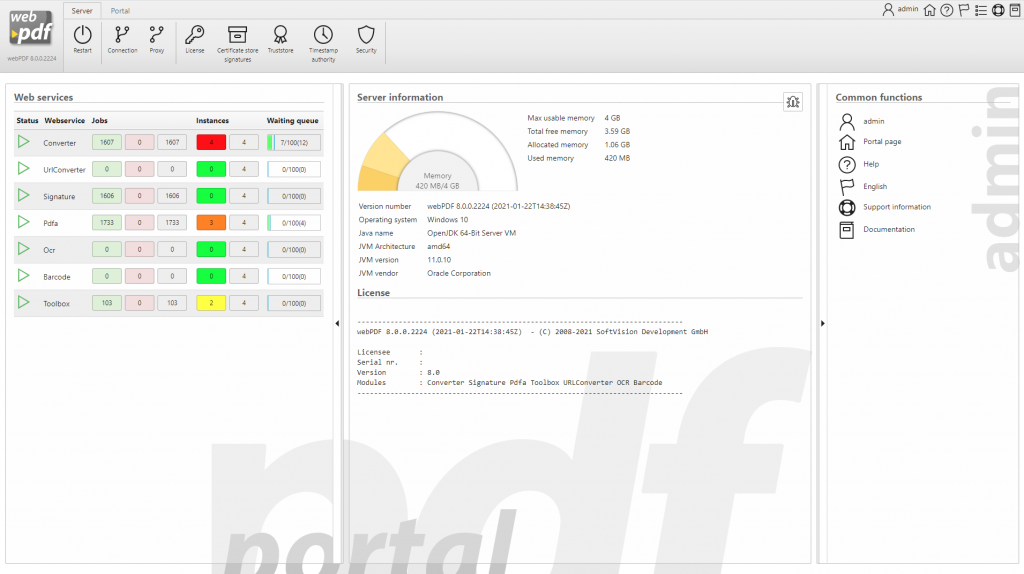
New: Status page with server load

With the latest update of webPDF 8, we provide a new feature in the web portal. As an extension of the dashboard in the administration area, you now get a server load display in the backend.
This lets you check the load of the server and the individual web services at any time. It helps you quickly identify when configuration adjustments or additional web service instances may be needed.
The new overview is available in the administration dashboard.
The extended dashboard shows the following information per web service:
- Jobs (1): Number of successful jobs (green), failed jobs (red), and total processed jobs (gray). This gives you a quick overview of how many jobs the webPDF server has handled since the last start.
- Instances (2): Available (licensed) and active instances per web service. Services such as "Converter", "Toolbox", or "Signature" can run in parallel as separate instances. The traffic-light color scheme (green to red) shows current utilization at a glance. If utilization stays in the red range for longer periods, increasing the number of instances may be useful.
- Waiting Queue (3): Current number of jobs waiting per web service. The blue line indicates the historical peak value. The closer this value is to the right limit, the higher the need for additional instances. If the queue reaches its maximum, the server stops accepting new jobs and returns error codes.
The display refreshes automatically at a defined interval, so the page does not need to be reloaded manually.
Further information on server information, performance, and instance configuration can be found in the Administration section of the user manual.