New: Status page with server load
With the latest update of webPDF 8 we provide you with a new feature for the web portal. As an extension of the dashboard in the administration area, you will now find a display of the server load in the backend.
This gives you the possibility to check the load of the server and the individual web services at any time. This allows you to quickly see when, for example, it is necessary to adjust the configuration or re-license additional instances of the web services.
The new overview can be found on the dashboard of the administration area.

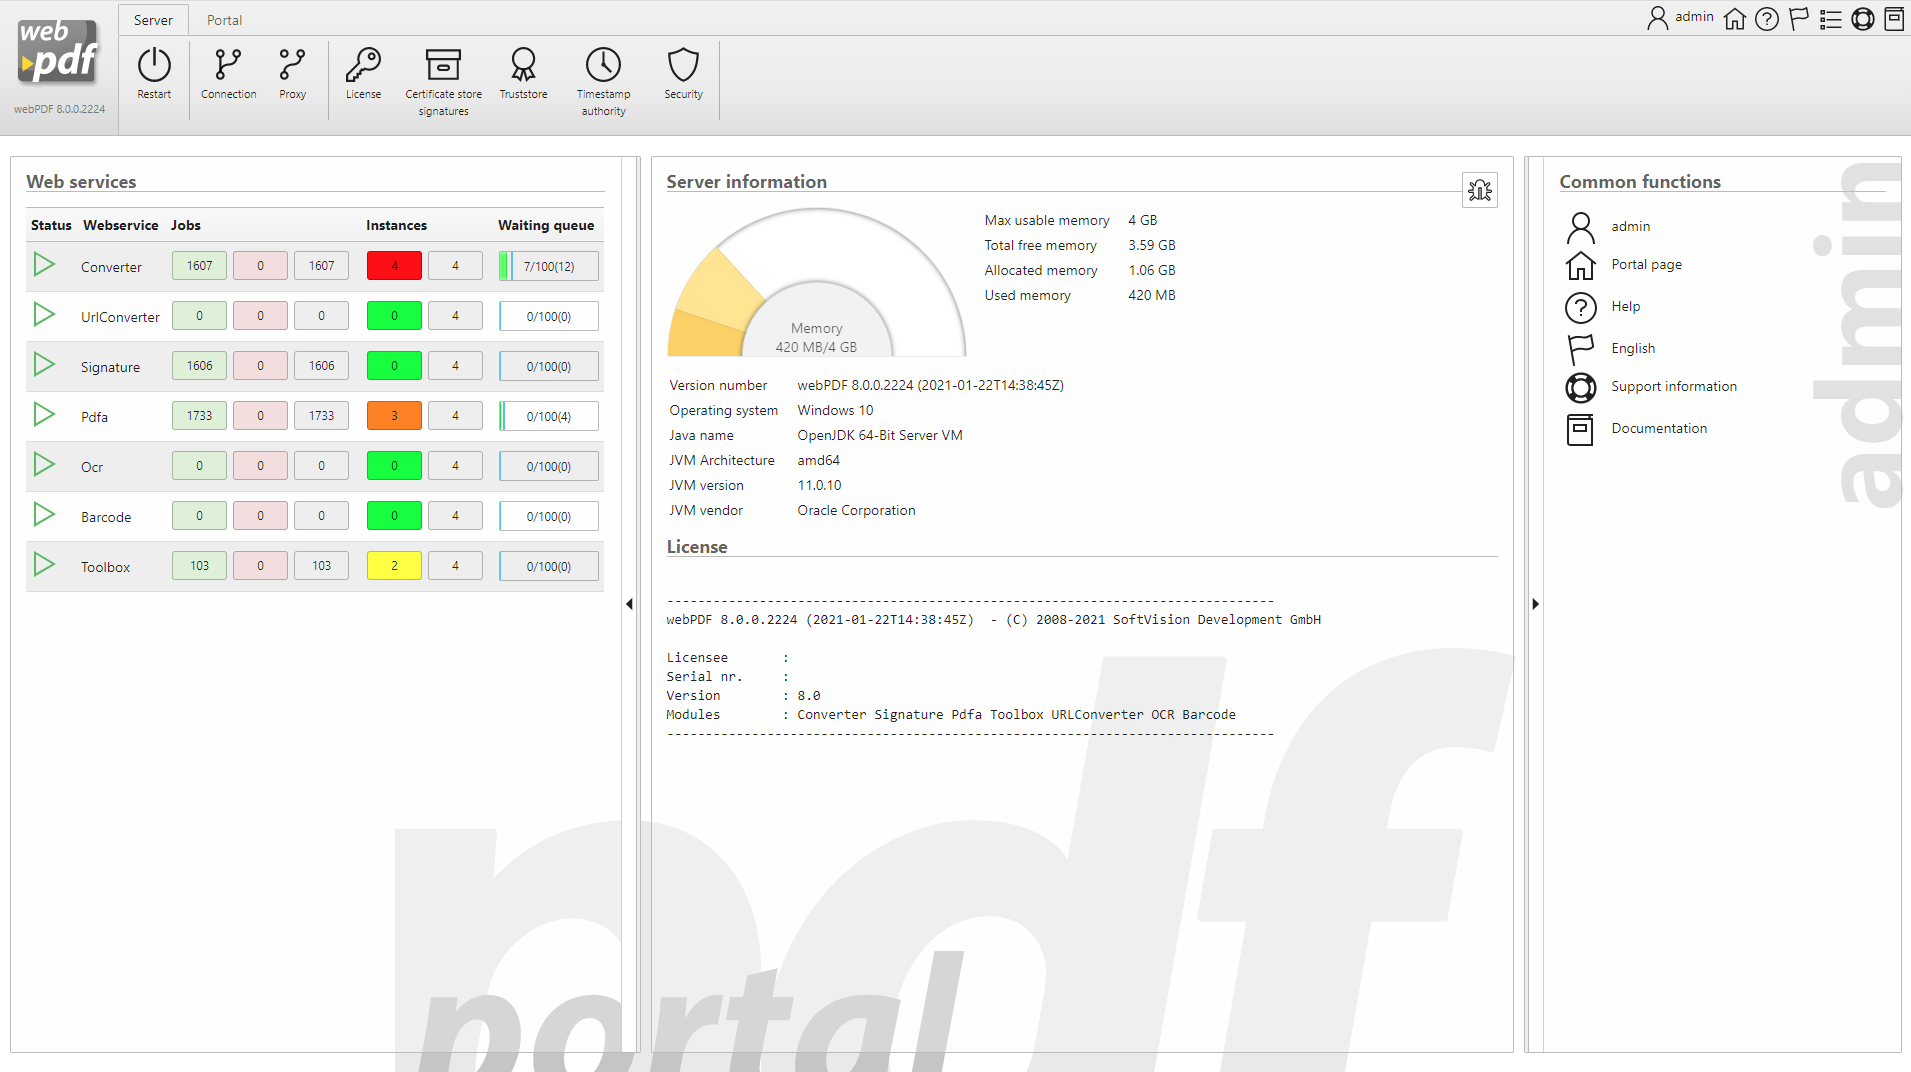
As can be seen in the graphic, the following information can now also be found in the overview for each web service on the extended dashboard:
- Jobs (1): You can see here the number of successfully (error-free) executed jobs (in green) as well as all erroneous jobs (in red), as well as the total sum of all executed jobs (in grey). This way you always have an overview of which and how many “jobs” the webPDF server has processed since the last start.
- Instances (2): Here you can see all available (licensed) and active instances (possible parallel requests) per web service. Various services run on the server as web services for the jobs (orders), such as “Converter”, “Toolbox” or “Signature”, which each take over the corresponding tasks. For example, several web services (as instances) can be active in parallel. These instances process the different documents at the same time so that not so many jobs pile up in the queue. Using the colours from green to red, the current use of the instances can be seen at a glance via a traffic light system. If the active instances reach the red area, the respective web service is fully utilised and further jobs must be queued. If this situation occurs over a longer period of time, it may make sense to increase the number of instances for the web service.
- Waiting Queue (3): The current number of jobs still waiting per web service can be seen in the waiting queue. It lists how many jobs are currently waiting to be processed by the instances. The blue line (the previous maximum value) shows how high the waiting jobs pile up at peak times. The further the blue line moves to the limit (right edge of the box), the higher the demand for instances becomes in order to avoid a possible complete utilisation of the web service and the server. If the queue reaches its maximum, no new jobs are accepted by the server and all requests are aborted with an error code.
The display refreshes automatically after a predefined interval, i.e. the page does not have to be reloaded manually.
Further information on the topics of server information, performance and adjustment of the instances can be found in the user manual in the Administration section.